

Introduction
Bitcoin continues to dominate the cryptocurrency market as traders assess whether the recent recovery marks the beginning of a larger bullish move or simply a temporary relief rally. After experiencing significant selling pressure in early June, Bitcoin has stabilized above a critical support zone and is now attempting to regain momentum.
While many investors focus solely on price predictions, professional traders rely on technical analysis, market structure, volume behavior, and investor sentiment to understand where the market may be heading next.
In this Bitcoin price analysis, we’ll examine the current BTC market structure, identify key support and resistance levels, evaluate trading volume, and discuss potential scenarios for the weeks ahead.
Current Market Snapshot
Bitcoin is currently trading around ₹63.9 Lakh (BTC/INR) on the daily timeframe. After reaching a local high near ₹82 Lakh, the market experienced a sharp correction that pushed prices below several short-term support levels.
However, buyers quickly stepped in near the ₹60 Lakh demand zone, preventing further downside and helping Bitcoin establish a short-term recovery structure.
The recent price action suggests that Bitcoin is attempting to build a base after the correction. While the broader market remains cautious, the ability of BTC to hold above key support levels indicates that demand remains present.
Bitcoin Daily Chart Analysis
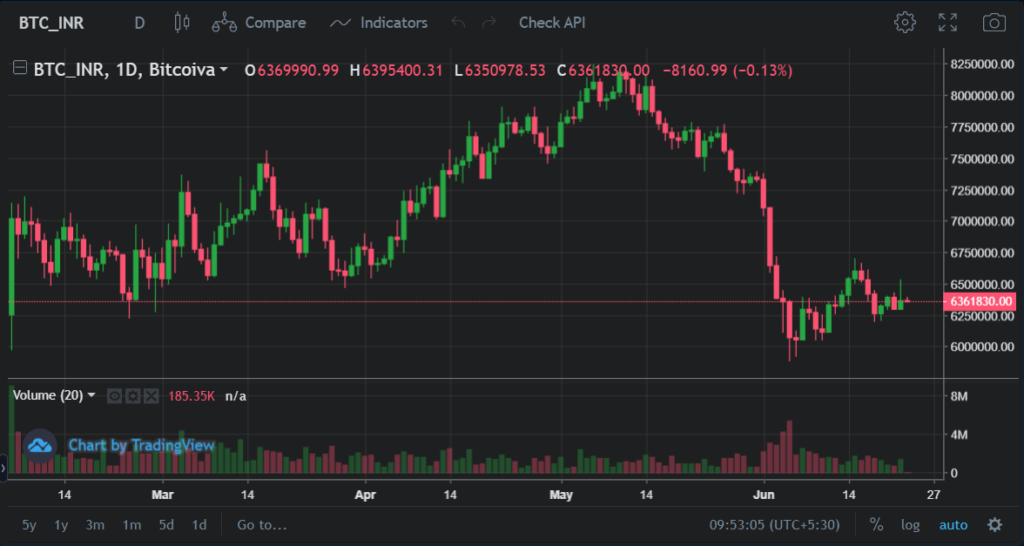
Source: Bitcoiva Trading Chart | BTC/INR
The BTC/INR daily chart reveals several important developments that traders should monitor closely.
Key Observations
1. Sharp Correction Followed by Stabilization
Bitcoin experienced a strong decline from approximately ₹82 Lakh to below ₹60 Lakh. This correction triggered increased trading activity and forced weaker market participants out of their positions.
Such corrections are common during broader uptrends and often help reset market sentiment.
2. Strong Buying Interest Near ₹60 Lakh
The chart clearly shows buyers stepping in aggressively around the ₹60 Lakh region.
This indicates:
- Strong demand
- Institutional accumulation potential
- Reduced selling pressure
The market’s ability to defend this level is a positive sign for the medium-term outlook.
3. Consolidation Phase Developing
Following the recovery, Bitcoin has entered a consolidation range between approximately ₹62 Lakh and ₹66 Lakh.
Consolidation periods are important because they often precede major directional moves.
The longer price remains stable within a range, the more significant the eventual breakout tends to become.
Market Structure Analysis
Market structure remains one of the most reliable tools for evaluating trend strength.
Previous Trend
Bitcoin maintained a strong bullish structure throughout April and May, creating a series of higher highs and higher lows.
This trend culminated near ₹82 Lakh before encountering significant selling pressure.
Current Structure
The June correction temporarily disrupted bullish momentum but failed to trigger a complete trend reversal.
Current price behavior suggests:
- Demand remains active
- Buyers continue defending support
- Selling pressure is decreasing
For bullish momentum to strengthen further, Bitcoin must establish higher highs above recent resistance levels.
Volume Analysis
Volume often provides confirmation of price action.
One of the most notable observations from the chart is the increase in volume during the June sell-off.
This surge in activity indicates:
- Panic selling from short-term traders
- Profit-taking from earlier buyers
- Increased participation from institutional and professional market participants
Since the recovery began, volume has gradually stabilized.
For Bitcoin to initiate a stronger upward move, traders should look for:
- Increased buying volume
- Strong daily candle closes
- Breakout volume above resistance
Without volume confirmation, bullish breakouts become less reliable.
Key Support and Resistance Levels
Technical levels help traders identify potential entry and exit zones.
Major Support Levels
| Level | Importance |
|---|---|
| ₹60,00,000 | Major Demand Zone |
| ₹62,00,000 | Current Support |
| ₹58,00,000 | Critical Breakdown Level |
Major Resistance Levels
| Level | Importance |
| ₹65,00,000 | Immediate Resistance |
| ₹70,00,000 | Major Breakout Zone |
| ₹75,00,000 | Trend Continuation Resistance |
A breakout above ₹65 Lakh with strong volume could signal renewed bullish momentum.
What the Recent Recovery Suggests
The bounce from the ₹60 Lakh support region provides valuable insight into current market sentiment.
Several positive factors are emerging:
Buyers Are Defending Key Levels
The market has repeatedly rejected lower prices, indicating strong interest from buyers.
Selling Pressure Is Slowing
The intensity of the decline has decreased significantly compared to the sharp sell-off witnessed earlier in the month.
Market Confidence Is Improving
The recovery above recent lows suggests investors remain optimistic about Bitcoin’s long-term potential.
However, confirmation remains necessary before declaring the beginning of a new bullish phase.
Trading Scenarios for June 2026
Bullish Scenario
For a bullish continuation, Bitcoin needs:
- Daily close above ₹65 Lakh
- Increased buying volume
- Higher highs on the daily timeframe
If these conditions are met, traders may begin targeting higher resistance zones.
Neutral Scenario
The most likely short-term outcome is continued consolidation.
Range:
₹62 Lakh – ₹65 Lakh
This would allow:
- Market stabilization
- Additional accumulation
- Improved liquidity
Bearish Scenario
A bearish outlook would emerge if:
- Bitcoin loses ₹60 Lakh support
- Selling volume increases
- Market sentiment weakens
Under this scenario, lower support levels could come into focus.
Key Levels Traders Should Watch
Bullish Trigger
Above ₹65,00,000
A sustained breakout could attract momentum traders and increase buying activity.
Neutral Zone
₹62,00,000 – ₹65,00,000
Current consolidation range.
Bearish Trigger
Below ₹60,00,000
Would indicate renewed selling pressure.
Risk Management Considerations
Regardless of market direction, risk management remains essential.
Successful traders typically:
- Use stop losses
- Manage position sizes carefully
- Avoid emotional trading decisions
- Follow predefined trading plans
No technical setup guarantees success, making capital preservation a priority.
Conclusion
Bitcoin’s recent price action suggests that the market is attempting to recover from a significant correction while maintaining critical support levels. The defense of the ₹60 Lakh region, combined with improving price stability, indicates that buyers remain active.
However, traders should remain patient and wait for confirmation through volume and resistance breakouts before assuming a larger bullish trend has begun.
The coming weeks may prove decisive for Bitcoin as it approaches key resistance zones. A successful breakout above ₹65 Lakh could strengthen the bullish outlook, while failure to maintain support may extend the current consolidation phase.
For now, Bitcoin remains in a recovery and accumulation stage, making volume, market structure, and key technical levels the most important indicators to watch.
Frequently Asked Questions
Is Bitcoin bullish right now?
Bitcoin is showing signs of recovery, but traders are waiting for confirmation through higher highs and stronger volume before confirming a bullish trend.
What is the most important support level?
The ₹60 Lakh zone currently represents the strongest support area visible on the daily chart.
What resistance level should traders monitor?
₹65 Lakh remains the most important near-term resistance level. A breakout above this region could improve market sentiment significantly.
Is Bitcoin currently in an accumulation phase?
The recent consolidation and stabilization near support suggest that the market may be undergoing an accumulation phase following the correction.