
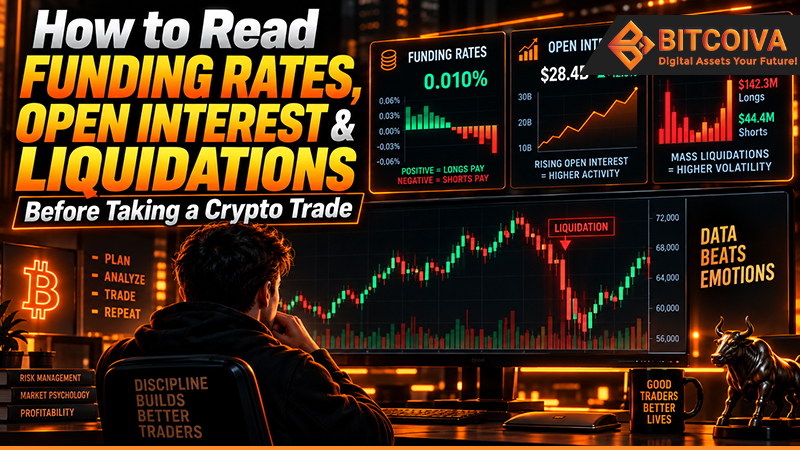
Bitcoin can rise sharply while risk is quietly building underneath the chart.
Price tells traders what is happening, but derivatives data can offer additional context about how the move is developing.
Is spot demand supporting the rally? Are leveraged traders aggressively chasing price? Are short positions being forced to close? Is open interest increasing rapidly enough to make the market more vulnerable to liquidations?
This is why many crypto traders monitor funding rates, open interest and liquidation data alongside price action, volume, support and resistance.
Bitcoin’s September 2026 market activity provides a useful real-world example.
Bitcoin Market Snapshot: September 22, 2026
During a market snapshot captured on September 22, 2026, CoinGlass showed Bitcoin trading near $85,253, up approximately 4.66% over 24 hours.
At the same snapshot:
- BTC Futures Volume (24h): approximately $117.68 billion
- BTC Spot Volume (24h): approximately $8.58 billion
- BTC Futures Open Interest: approximately $61.21 billion
These numbers represent market conditions at the time they were observed. Cryptocurrency prices, volume, open interest and liquidation figures change continuously.
At this snapshot, reported derivatives trading volume was substantially higher than reported spot volume. However, the figures should be interpreted carefully because aggregated spot and derivatives datasets can cover different exchanges, instruments and market structures.
High futures activity alone does not tell traders whether Bitcoin will rise or fall.
That is where funding rates, open interest and liquidation data become useful.
What Does the Funding Rate Tell Crypto Traders?
A funding rate is a periodic payment exchanged between traders holding perpetual futures positions.
When funding is positive, long-position holders generally pay short-position holders.
When funding is negative, short-position holders generally pay long-position holders.
Funding helps keep perpetual futures prices reasonably aligned with the underlying spot market.
However, funding should never be treated as a direct buy-or-sell signal.
Example: Bitcoin Rises With Moderate Funding
Imagine Bitcoin moves:
$82,000 → $84,000 → $85,000
while funding remains relatively moderate.
This may suggest that leveraged traders are participating without the perpetual market becoming extremely one-sided.
Now imagine Bitcoin reaches $85,000 while:
- Open interest rises rapidly
- Funding becomes unusually positive
- Leveraged long positions continue increasing
That creates a different market environment.
It may suggest that long positioning is becoming crowded.
This does not mean Bitcoin must fall. But if price reverses sharply, highly leveraged longs may become more vulnerable to liquidation.
Real Funding Cost Example
Suppose a trader holds a BTC perpetual position worth:
$20,000
and the applicable funding rate is:
0.01%
The funding amount would be:
$20,000 × 0.01% = $2
One payment may appear insignificant.
But larger positions, repeated funding intervals and unusually elevated funding rates can increase the cost of keeping a leveraged position open.
Funding should therefore be considered as both a positioning indicator and a trading cost.
How Should Traders Read Bitcoin Open Interest?
Open interest, commonly called OI, measures futures contracts that remain outstanding rather than having been closed or offset.
It is different from trading volume.
Trading volume measures activity during a period.
Open interest measures how much derivatives exposure remains open.
The number becomes more useful when traders compare changes in OI with changes in price.
Price Rising + Open Interest Rising
New or replacement derivatives positions are entering faster than existing positions are closing.
This can indicate stronger participation, but rapidly expanding leverage may also increase future liquidation risk.
Price Rising + Open Interest Falling
Positions are being closed while price is moving higher.
Short covering may be contributing to the rally, although OI alone cannot identify exactly which side is exiting.
Price Falling + Open Interest Rising
New derivatives exposure is entering while price declines.
This could include new short positions, traders attempting to buy the decline, or both.
Price Falling + Open Interest Falling
Positions are being closed or liquidated while price falls.
This is commonly described as deleveraging.
The important point is:
Open interest shows whether derivatives exposure is expanding or contracting. It does not independently tell traders whether the market is bullish or bearish.
Real Example: Bitcoin’s September 21 Short Squeeze
Bitcoin’s September 21, 2026 rally provides a useful real-world example.
CoinDesk reported Bitcoin trading around $84,984, extending its move above the September 4 high of approximately $82,284.
During the reported 24-hour period:
- Total crypto liquidations reached approximately $746.6 million
- Short liquidations accounted for approximately $647.9 million
- Bitcoin shorts specifically accounted for approximately $277.5 million
- Ether shorts accounted for approximately $122.8 million
- Total crypto-market open interest increased 7.59% to $156 billion
- 24-hour derivatives volume increased approximately 39% to $224 billion
The distinction between these figures is important.
The $647.9 million figure represented short liquidations across the broader cryptocurrency market.
It was not $647.9 million in Bitcoin shorts alone.
Bitcoin short liquidations accounted for approximately $277.5 million during the reported period.
What Can Traders Learn From the Move?
A short position generally benefits when price falls.
When Bitcoin instead rises rapidly, leveraged short traders can face increasing losses.
If their available collateral is no longer sufficient to satisfy margin requirements, positions may be automatically reduced or liquidated.
This can create a chain reaction:
BTC rises → shorts face losses → leveraged shorts are liquidated → forced position closures create additional buying pressure → BTC rises further → more shorts become vulnerable
This process is commonly called a short squeeze.
But there was another important detail in the September 21 market move.
Even while substantial short exposure was being closed, total crypto-market open interest increased.
This suggests that new or replacement derivatives positions were entering faster than positions were disappearing.
Therefore, traders were not simply leaving the derivatives market after the squeeze.
New leverage was also entering.
That gives traders much more information than a green Bitcoin candlestick alone.
How to Combine Funding, Open Interest and Liquidations
No single derivatives metric should determine a trade.
Instead, traders can study how the indicators behave together.
Scenario 1: More Balanced Breakout
Bitcoin breaks above resistance.
Open interest increases gradually.
Funding remains relatively moderate.
Reported spot-market activity also increases.
Price remains above the breakout level after the first liquidation wave.
This may indicate that market participation extends beyond a temporary short squeeze.
It still does not guarantee continued upside.
Scenario 2: Crowded Leveraged Rally
Bitcoin rises rapidly.
Open interest expands aggressively.
Funding becomes unusually positive.
Large short liquidations have already occurred.
Derivatives activity remains extremely high compared with reported spot activity.
This does not automatically mean Bitcoin will reverse.
However, it tells traders that substantial leverage is present.
If price suddenly moves in the opposite direction, leveraged positions can amplify volatility.
Scenario 3: Potential Short-Squeeze Conditions
Bitcoin holds an important support area.
Open interest rises.
Funding becomes strongly negative.
Short positioning appears increasingly aggressive.
Bitcoin then breaks above an important resistance level.
If the breakout continues, leveraged short traders can come under pressure, potentially creating additional forced position closures.
Again, this is a market condition to investigate, not a guaranteed trading signal.
5 Things to Check Before a Leveraged Crypto Trade
1. Check Market Structure
Identify the trend, important support and resistance zones, and the level that would invalidate your trade idea.
2. Check Open Interest
Determine whether derivatives exposure is expanding or contracting while price moves.
3. Check Funding
Look at whether perpetual futures positioning appears relatively balanced or heavily concentrated toward one side.
4. Check Recent Liquidations
Determine whether the current move is being amplified by forced position closures.
A large liquidation event can temporarily accelerate price movement.
5. Compare Spot and Derivatives Activity
Check whether reported spot-market participation is strengthening alongside the derivatives move.
A futures-driven move and a spot-supported move can have very different market dynamics.
Final Takeaway
Funding rates, open interest and liquidation data help traders see what may be happening behind the Bitcoin price chart.
Funding provides information about perpetual futures positioning and the cost of maintaining positions.
Open interest shows whether outstanding derivatives exposure is growing or shrinking.
Liquidation data reveals when leveraged positions are being forcibly closed.
The September 2026 Bitcoin rally demonstrates why combining these indicators matters.
A trader looking only at price would see Bitcoin moving higher.
A trader studying derivatives data could also identify short liquidations, expanding open interest, changing positioning and increasing leverage underneath the rally.
None of these indicators can predict Bitcoin’s next move with certainty.
But when combined with price structure, volume, position sizing and disciplined risk management, they can give traders a more complete view of market conditions before entering a position.
Visit: www.bitcoiva.com
Frequently Asked Questions
Is a positive Bitcoin funding rate bullish or bearish?
Neither automatically.
Positive funding generally means long-position holders are paying short-position holders. Extremely elevated positive funding can indicate crowded leveraged long positioning, but it does not guarantee that Bitcoin will fall.
Does rising open interest mean Bitcoin will rise?
No.
Increasing open interest means outstanding derivatives exposure is growing. Traders need to compare OI with price, funding, volume, liquidations and broader market structure.
What is a Bitcoin short squeeze?
A short squeeze occurs when rising prices put pressure on leveraged short positions.
When some shorts are forced to close or are liquidated, the resulting position closures can add buying pressure and potentially accelerate the upward move.
What is a liquidation cascade?
A liquidation cascade occurs when rapid price movement triggers leveraged liquidations, which can contribute to further price movement and cause additional positions to be liquidated.
It can occur on both the long and short sides.
Can a liquidation heatmap predict Bitcoin’s price?
No.
A liquidation heatmap can estimate areas where leveraged positions may be concentrated, but it cannot guarantee that Bitcoin will reach those levels or reverse after reaching them.
Which is more useful: funding rate, open interest or liquidations?
They are usually more useful when analyzed together.
Funding provides information about perpetual positioning, open interest shows whether exposure is expanding or contracting, and liquidation data highlights forced position closures.