

When a cryptocurrency market sees steady price decreases, it enters a bear market. According to Investopedia, “it often depicts a situation in which securities values decline 20% or more from recent highs amid pervasive pessimism and negative investor sentiment.”
Bear markets can also be related to specific securities or commodities. Bear markets , frequently linked to decreases in an overall market or index, such as the S&P 500. They may also be linked to a financial crisis like a recession.
Investopedia claims that the causes can be several. However, in general, variables like a poor or declining economy, pandemics, war, or burst market bubbles can be an influence.
Is This Your First Time Facing A Bear Market
This article examines what happened during the previous bear market in 2018 and what is happening during the present crypto crisis in the Top Cryptocurrency Exchange In India. Learn about the main distinctions and what you could anticipate during current market collapse.
Price of Bitcoin During Bear Markets
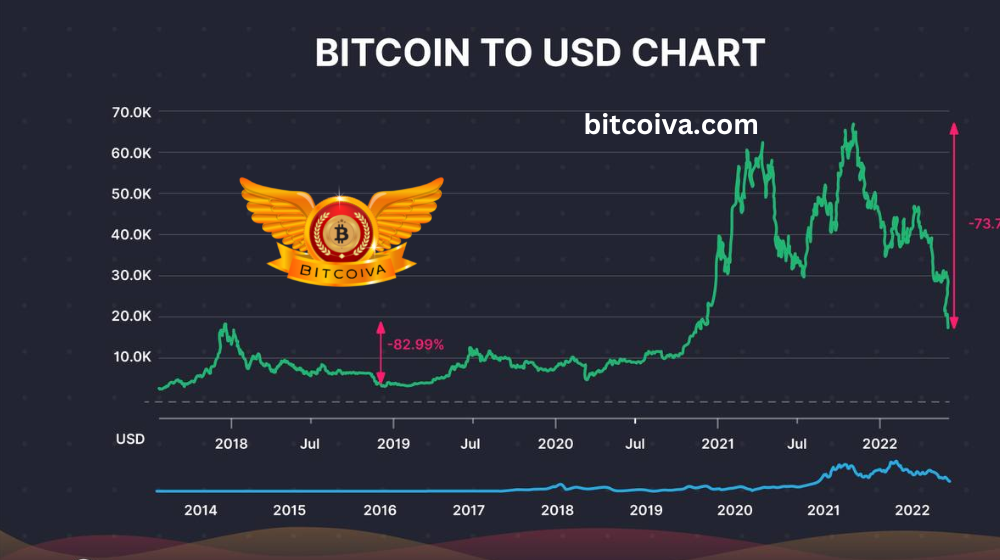
A value of $19.1K was the all-time high (ATH) for Bitcoin in December 2017. It plummeted during the course of the following year, reaching a low of $3.2K, or a maximum drawdown of 83%.
From its 2021 ATH, #Bitcoin has currently dropped by 73%. It might drop as low as $11.4K if the drawdown is similar to what was experienced in 2017. To replicate the 18-month bear market experienced in 2018–19, another 11 months of loss may be in store.
Nevertheless, figures from Glassnode show that the current realised price of Bitcoin is $23,340. This represents the average cost per Bitcoin in the supply as of its most recent on-chain transaction. Rarely, and usually near the conclusion of a bear market, does the price of bitcoin go below this level.
Bitcoin’s Actual Price
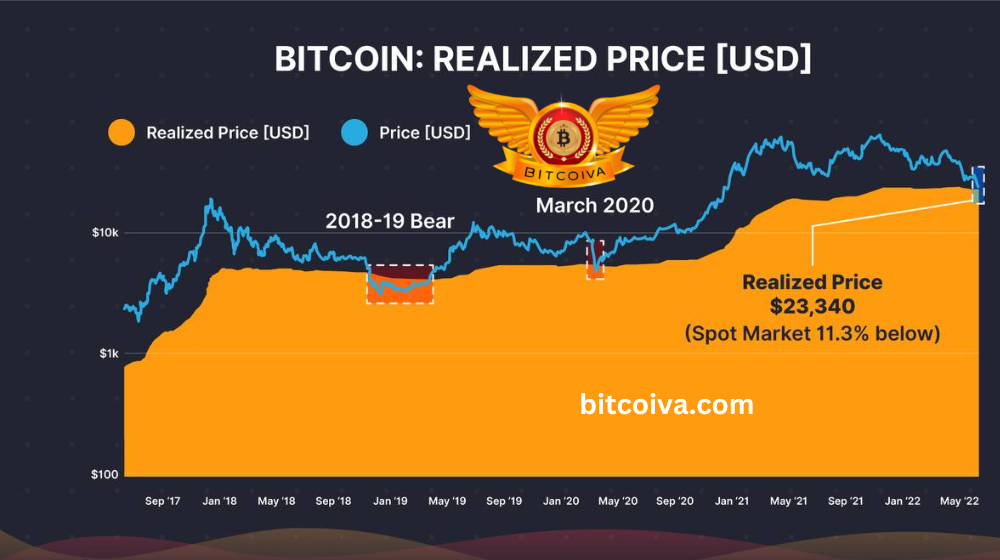
BTC is currently selling at a discount of about 11% to its realized price, or $20,700. It’s also trading at a similar discount to what it would normally cost to mine. This can be interpreted as a sign that the bottom is not too far away.
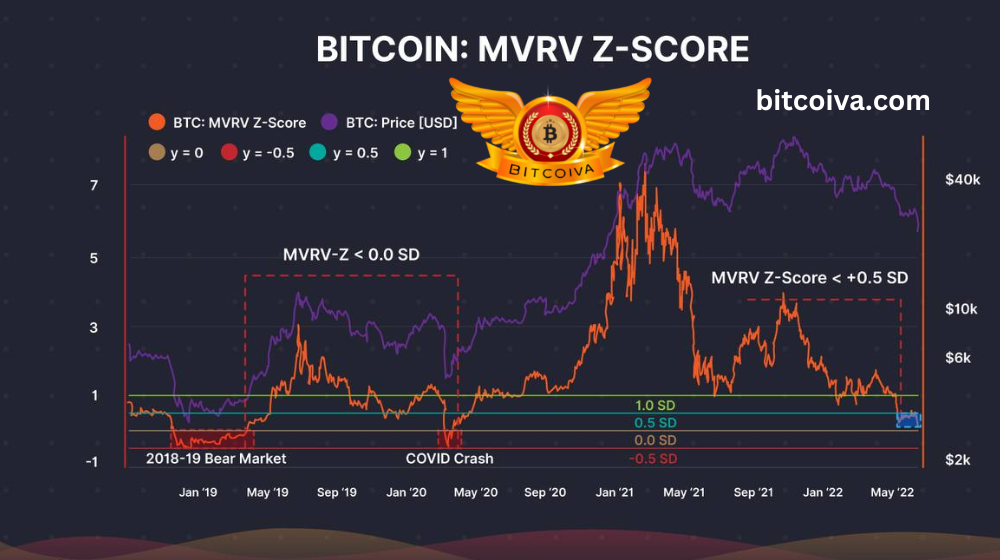
The MVRV Z-score for Bitcoin in the India Cryptocurrency Exchange, which measures the discrepancy between market value and realized value, indicates that the cryptocurrency is currently undervalued. However it did hit far lower levels in 2018 and 2020.
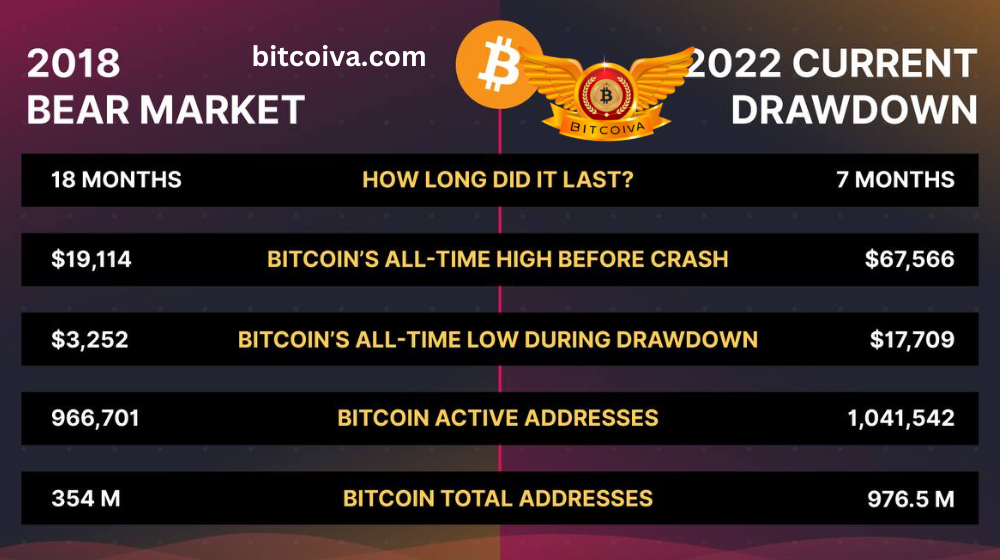
Between the 2017 and 2021 peaks, the number of daily active Bitcoin addresses climbed by around 10%, going from 966,701 in December 2021 to 1.041 million in April 2021. Comparatively, throughout the same time period, the market cap of Bitcoin rose by 300%.
The total number of Bitcoin addresses nearly tripled during this time, going from 354 million to 976.5 million. While the number of daily active addresses only climbed by 10%. Current rise in the number of active and total Bitcoin addresses has helped the network as a whole . It become more frequently used and transacted in this market cycle as opposed to 2017.
The average daily volume of bitcoin is currently close to $5–6 billion, up from $0.8–0.9 billion in 2017.
Price of Ethereum in Bear Markets
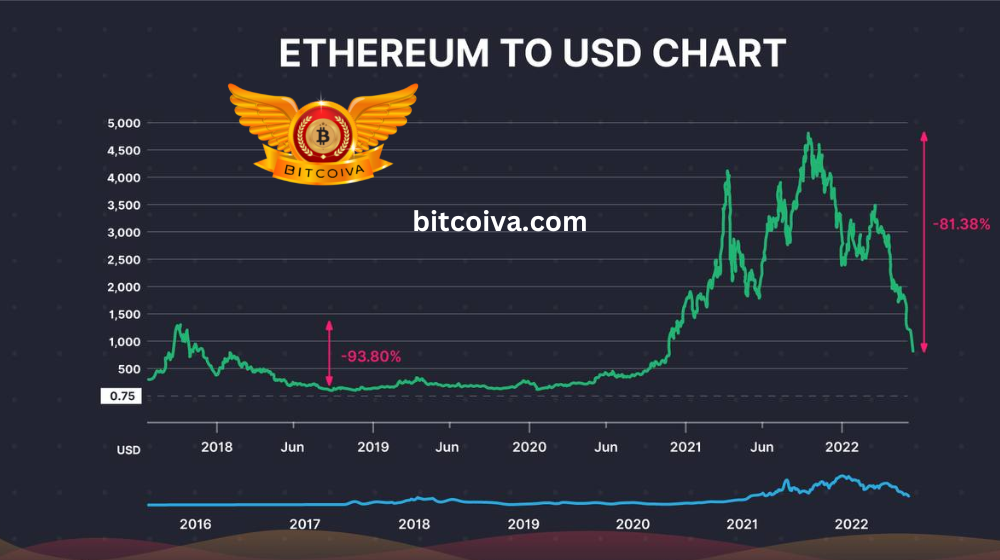
In the recent bear market, Crypto Trading App India, Ethereum, performed far worse than Bitcoin. Between January and December 2018, $ETH experienced a 93.8% decrease, falling from an ATH of $1,396 to a low of $86.54.
Ether has dropped from $4,812 to $896 during the past 7 months. It represented an 81% decline from its all-time high (ATH) in 2021.
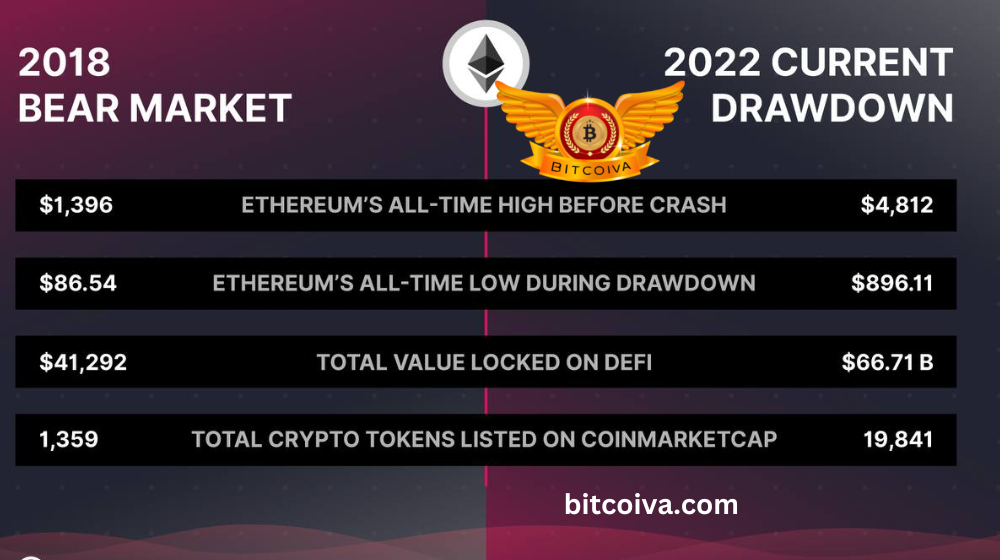
Despite the fact that, World’s Largest Cryptocurrency Exchange which supports cryptocurrencies like Ethereum’s value increased by 244% between its 2018 and 2021 ATHs, the total value locked (TVL) in decentralised finance (DeFi) shot up to $66.7 billion in the wake of the introduction of DeFi apps on Ethereum like Uniswap, Compound, Synthetix, and Yearn (and reaching $184.5 billion at its peak), where the majority of activity is focused on the Ethereum network. The overall number of tokens listed increased throughout this time, going from 1,359 to almost 20,000.
Ether might drop as low as $292 if it replicates the 93.8% dip it experienced during the 2018 bear market. For comparison, that would mean a further 67% decline from its present all-time low of $896.11.
Bear Market Token List
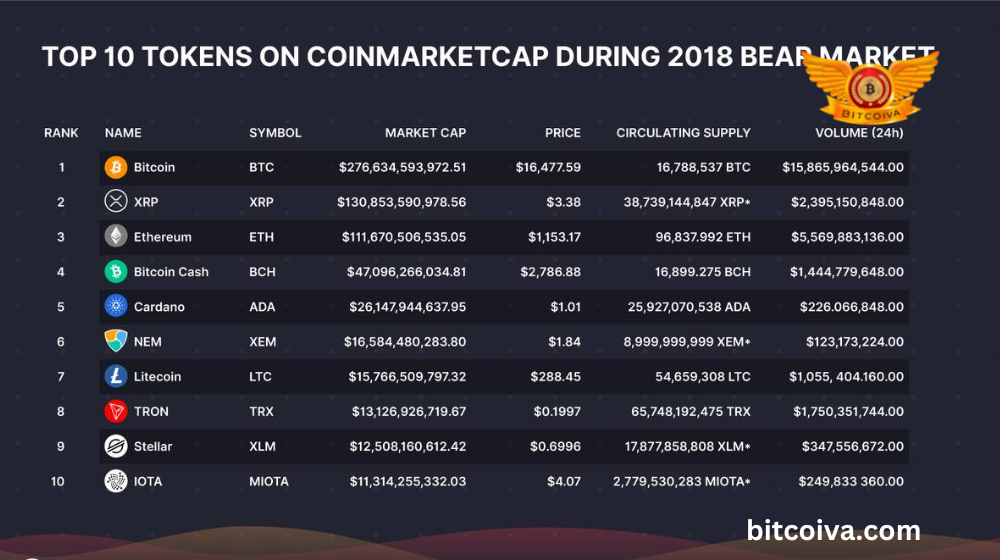
It should be emphasized that over half of the top 10 crypto tokens by market cap in 2017 failed to regain their former glory, despite the belief of current investors that DCA-ing into some or all of the Top 10 Indian Crypto Exchanges will best balance risk.
As a result of their declines, Bitcoin Cash (BCH), NEM, Stellar (XLM), and IOTA (MIOTA) no longer occupy a spot among the top 10. BCH (previously rank 4), NEM (formerly rank 6, now rank 102), XLM (previously rank 9, now rank 24), and MIOTA (previously rank 10, now rank 63).
In spite of experiencing a sizable rebound from their ATLs, all four of these cryptocurrencies failed to surpass their 2017 ATHs during the 2021 bull run.
Predicting precisely how a bear market would unfold is never easy, especially given the uncertain macroeconomic environment of today. It is generally understood. However, that those who act well now will stand to gain the most if/when the market recovers.
Visit us on: www.bitcoiva.com
Comments are closed.